04:00
Grammar of graphics
Lecture 2
2024-01-18
Git and GitHub
![]()
- Git is a version control system – like “Track Changes” features from Microsoft Word, on steroids
- It’s not the only version control system, but it’s a very popular one
![]()
GitHub is the home for your Git-based projects on the internet – like DropBox but much, much better
We will use GitHub as a platform for web hosting and collaboration (and as our course management system!)
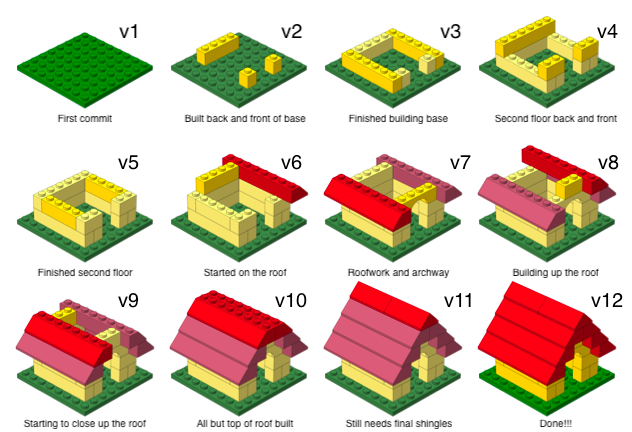
Versioning - done badly
Versioning - done better

Versioning - done even better
with human readable messages
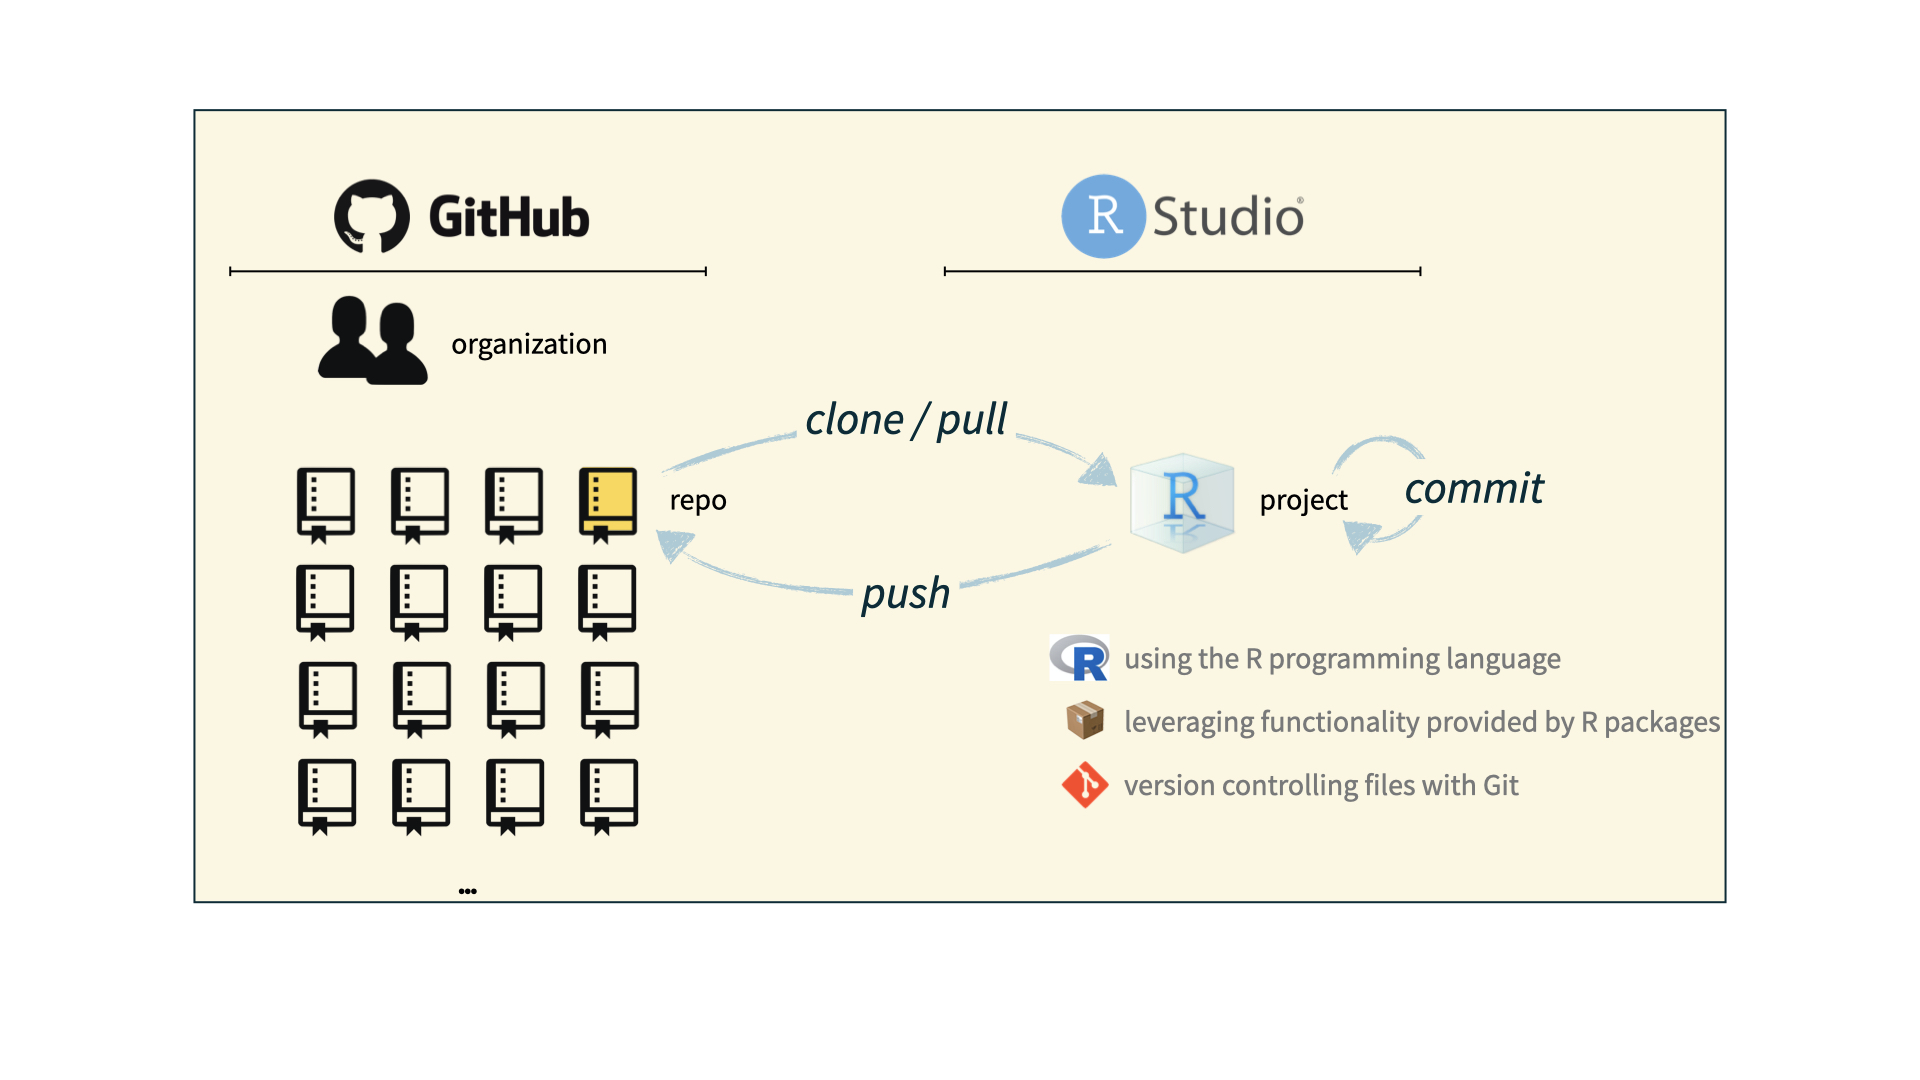
How will we use Git and GitHub?
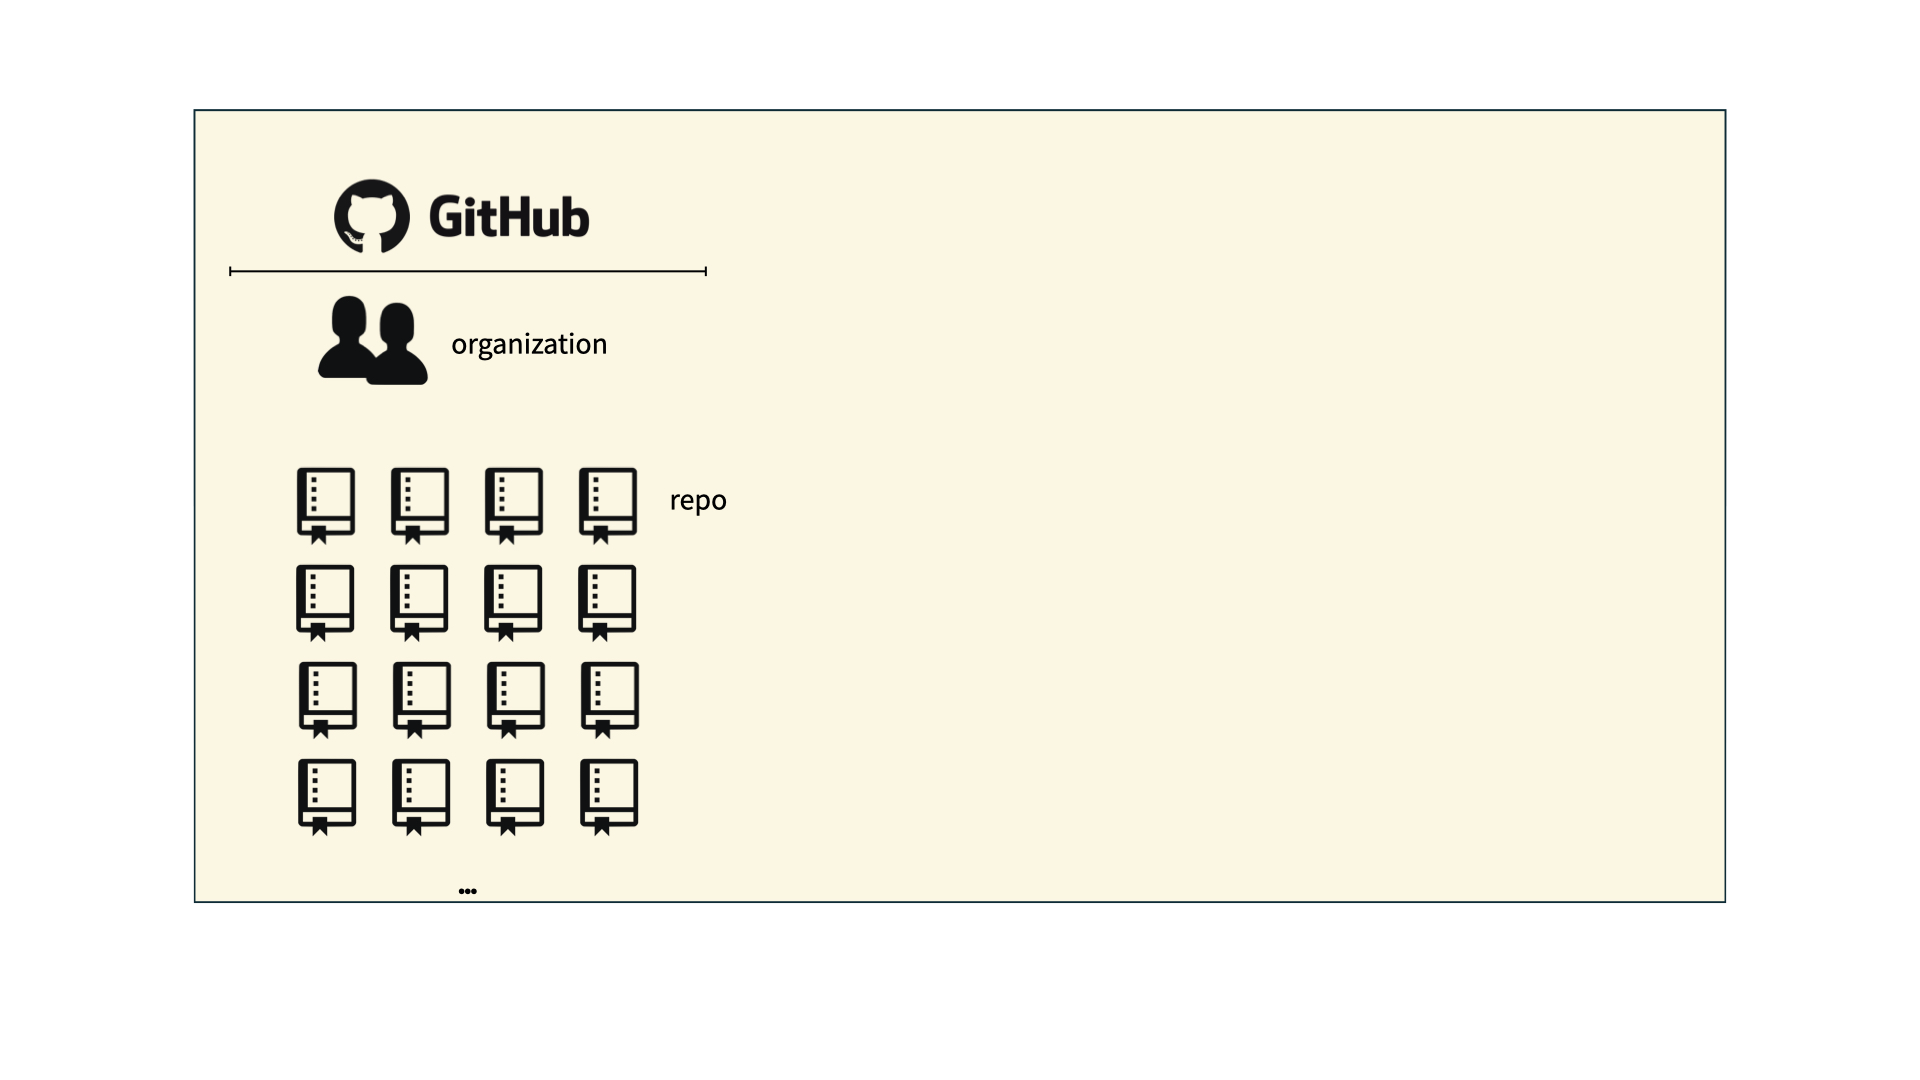
How will we use Git and GitHub?
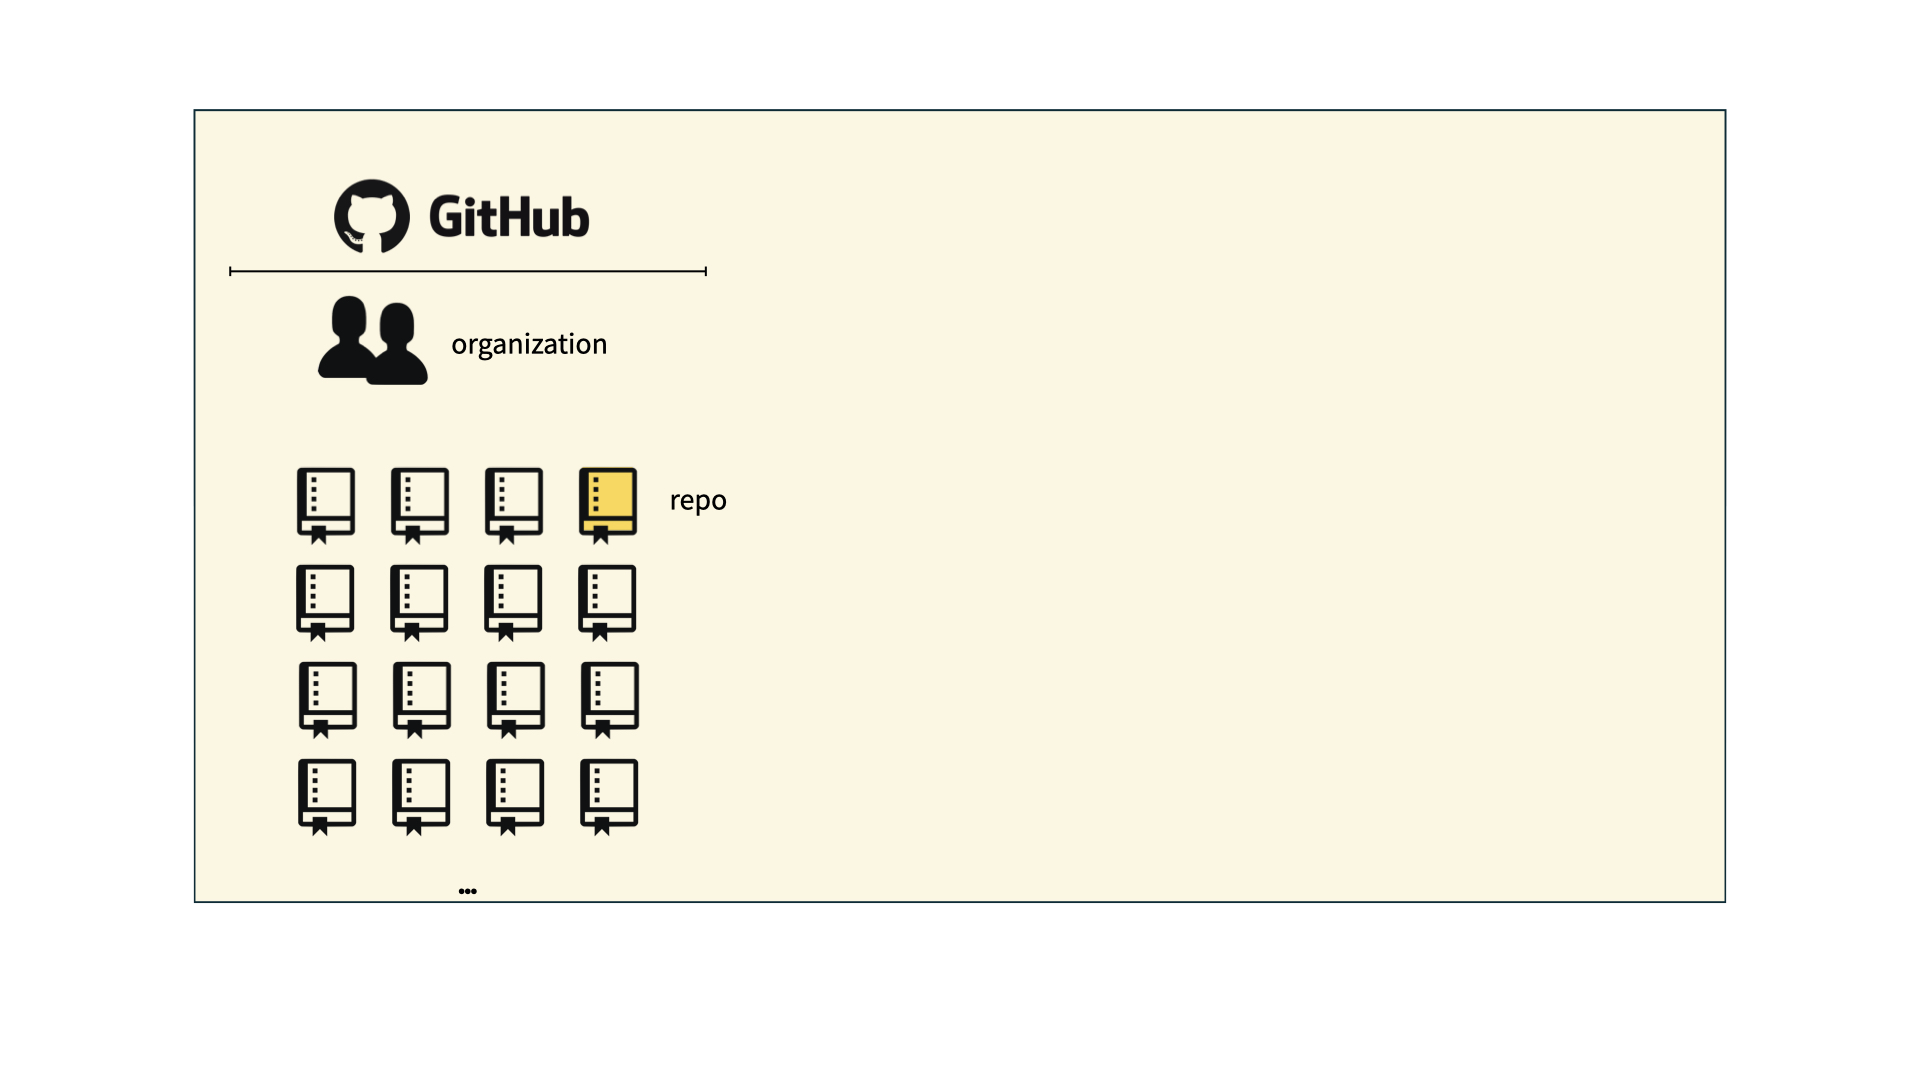
How will we use Git and GitHub?
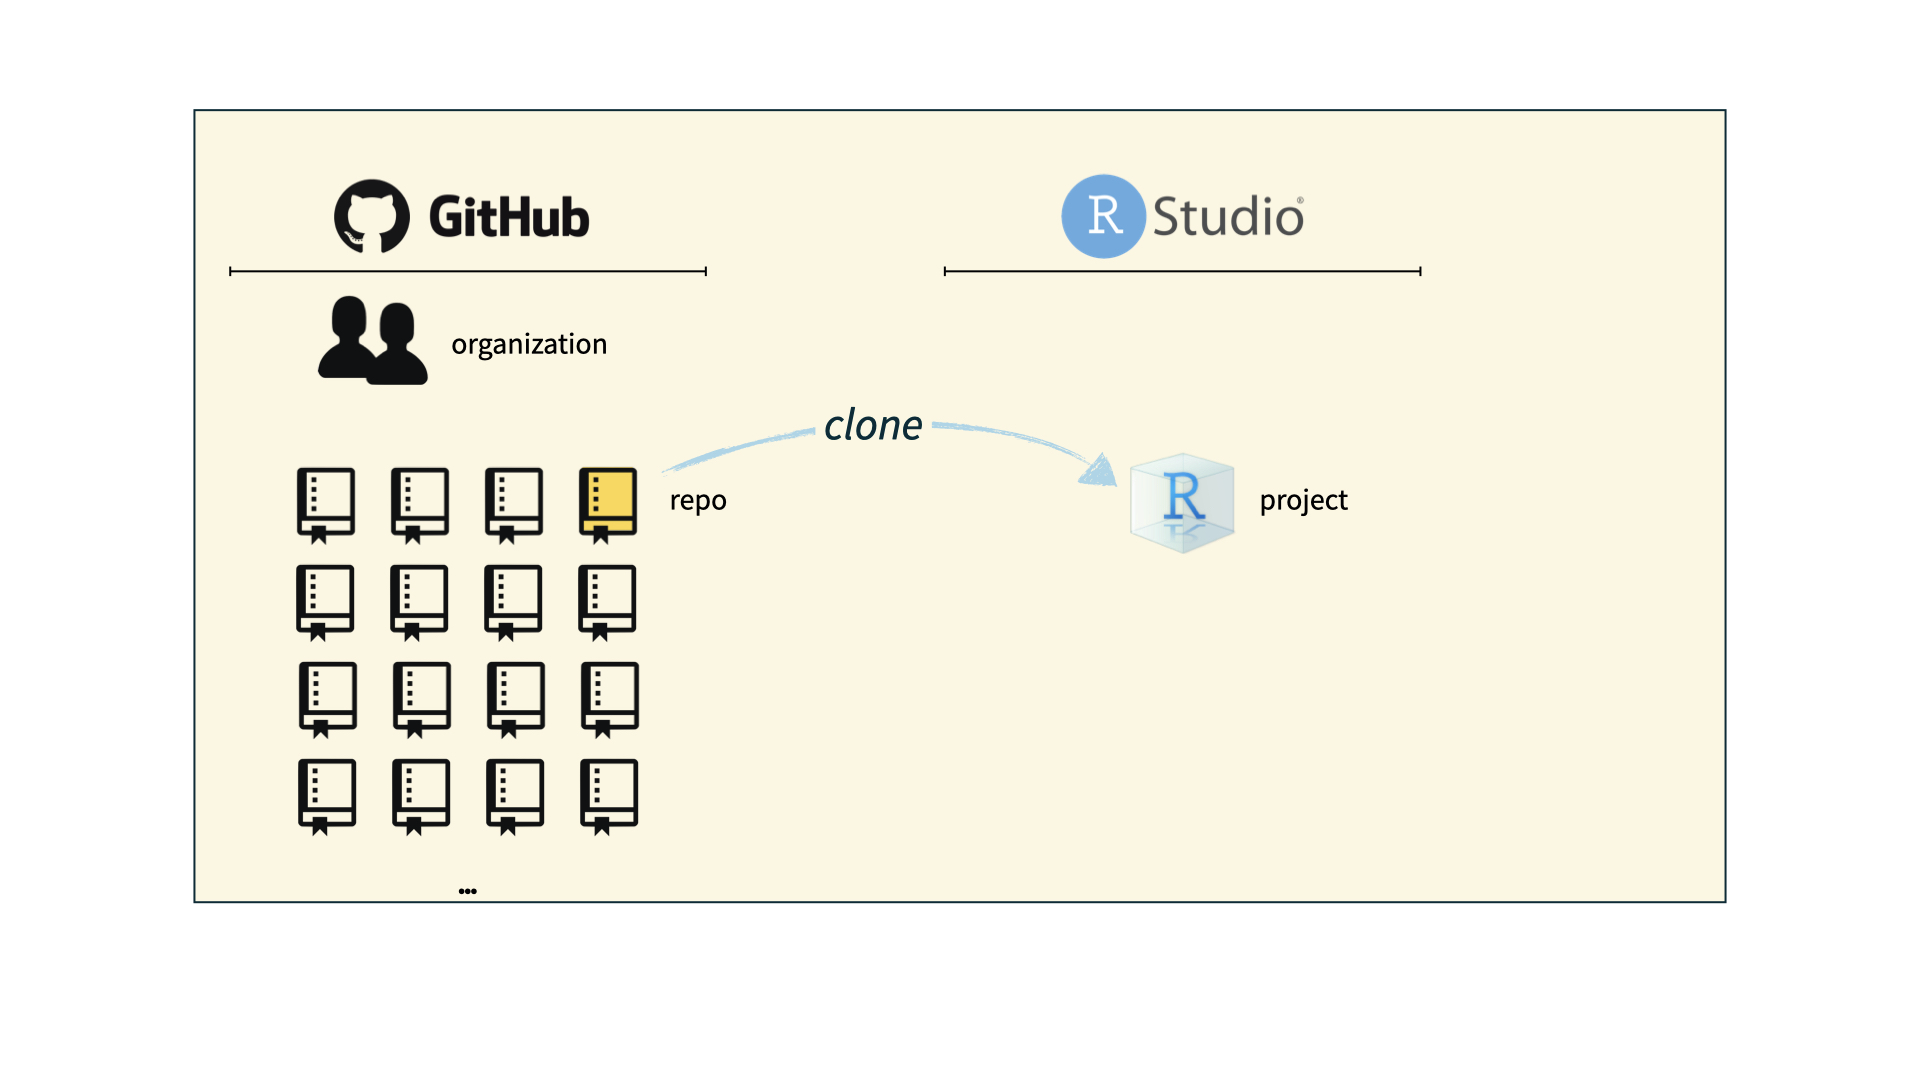
How will we use Git and GitHub?
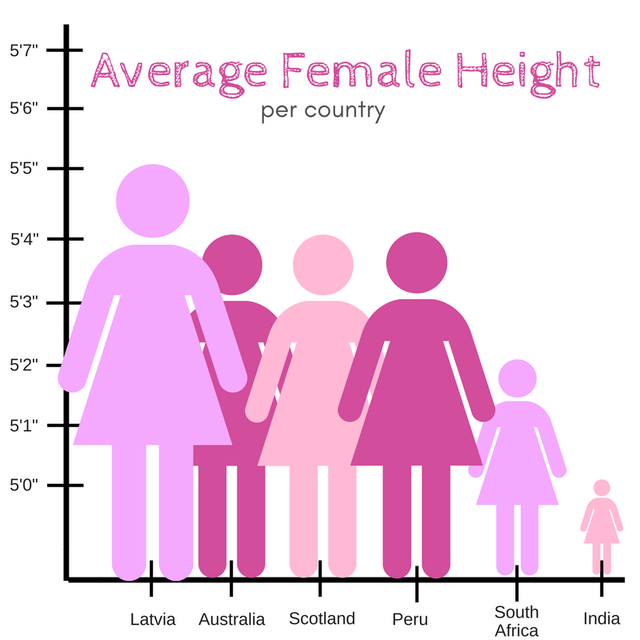
Examining data visualization
Discuss the following for the visualization.
Recap of AE
- Construct plots with
ggplot(). - Layers of ggplots are separated by
+s. - The formula is (almost) always as follows:
- Aesthetic attributes of a geometries (color, size, transparency, etc.) can be mapped to variables in the data or set by the user, e.g.
color = binaryvs.color = "pink". - Use
facet_wrap()when faceting (creating small multiples) by one variable andfacet_grid()when faceting by two variables.
![]()