Data visualization overview
Lecture 4
2024-01-25
Announcements
Lab 1 due Monday morning at 8 am.
My office hours today after class + 2-3 pm in Old Chem 213
Lots of TA office hours, including over the weekend
Submitting late and want to use your one-time waiver? Email our course coordinator Dr. Mary Knox.
AEs this week should be submitted by midnight on Sunday. To “submit”, commit and push at least once to your
aerepo for each application exercise this week.Pilot: Ed Discussion threads for lecture, linked at the bottom of each slide.
Questions from last time
Many of the questions in Lab 1 are subjective. How does that work?
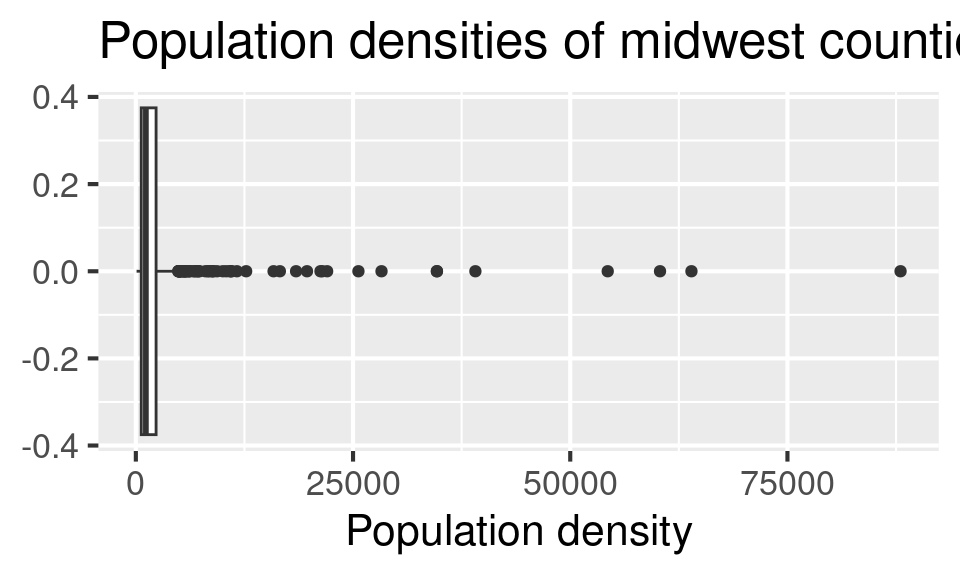
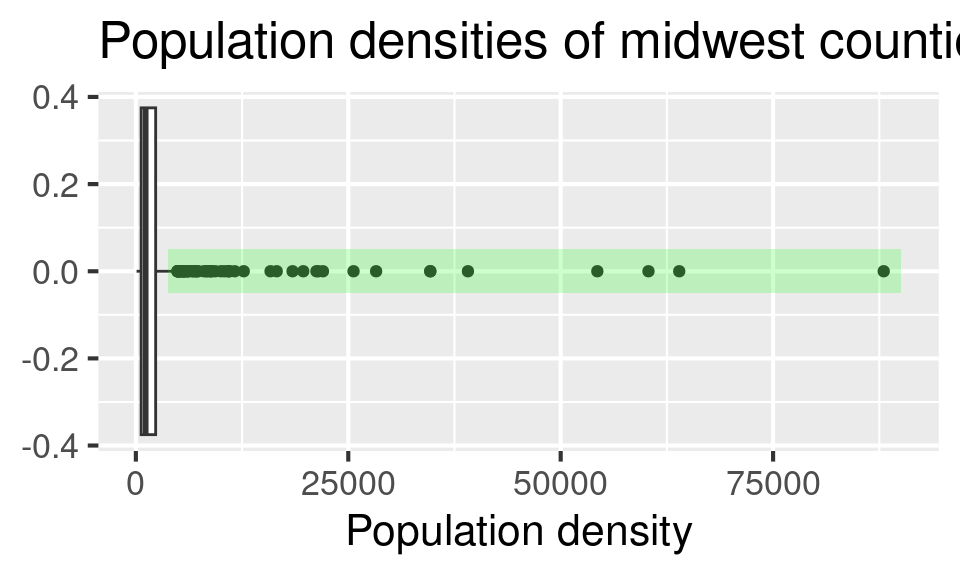
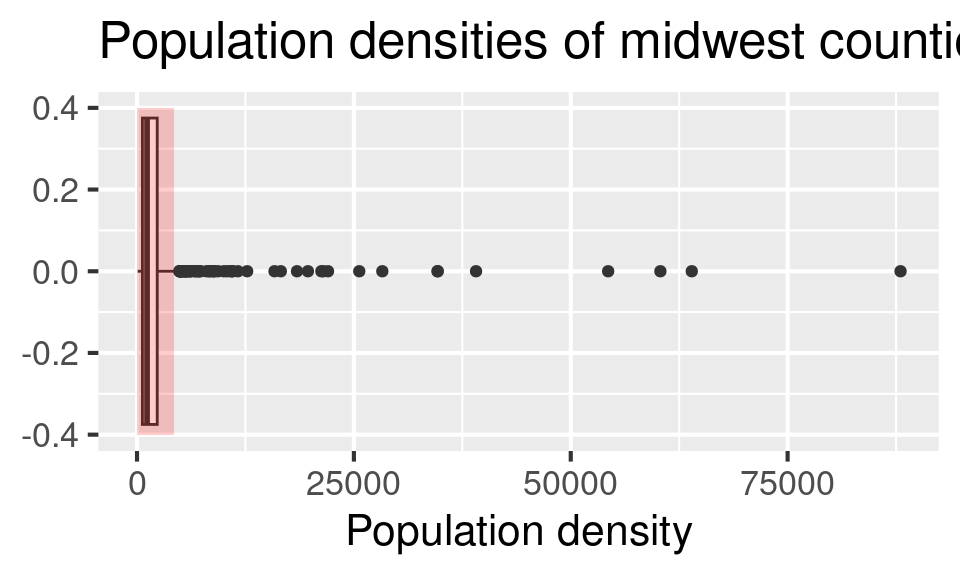
identify at least one outlier
Questions from last time
Many of the questions in Lab 1 are subjective. How does that work?
identify at least one outlier ✅
Questions from last time
Many of the questions in Lab 1 are subjective. How does that work?
identify at least one outlier ❌
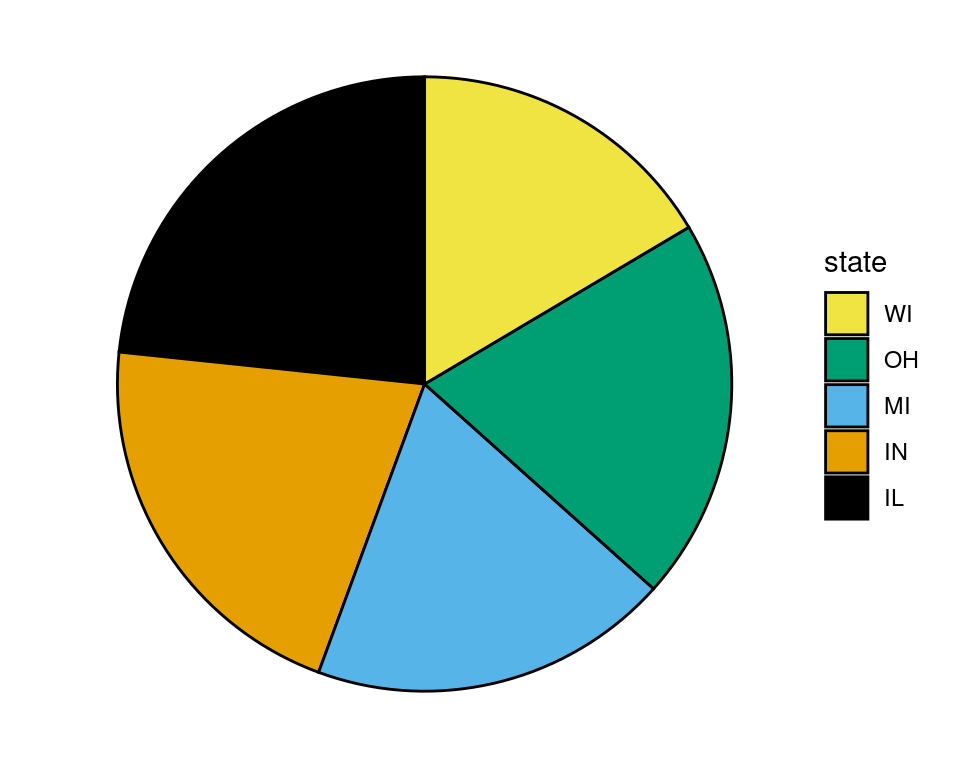
🥧 or 🧇?
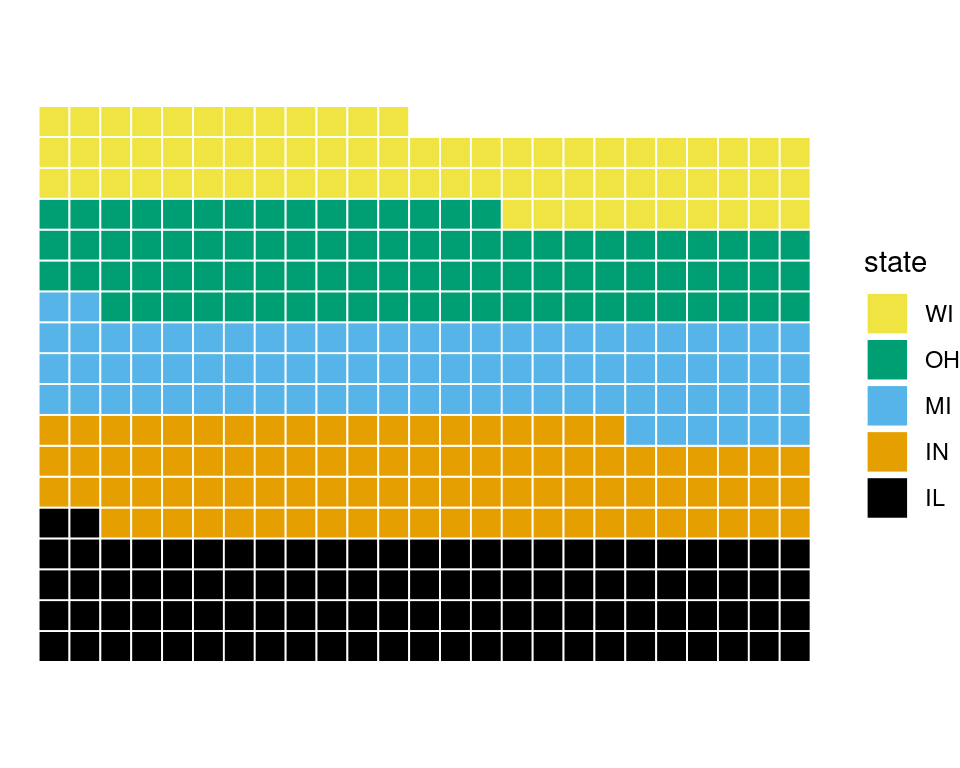
🥧 or 🧇 or ?


Bivariate analysis
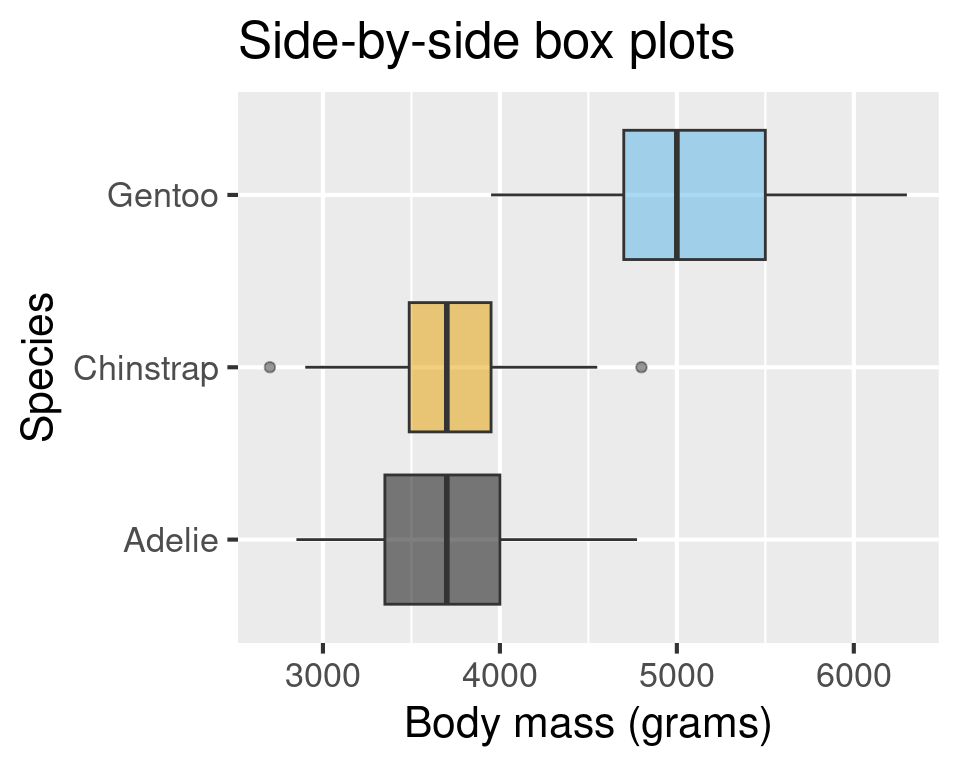
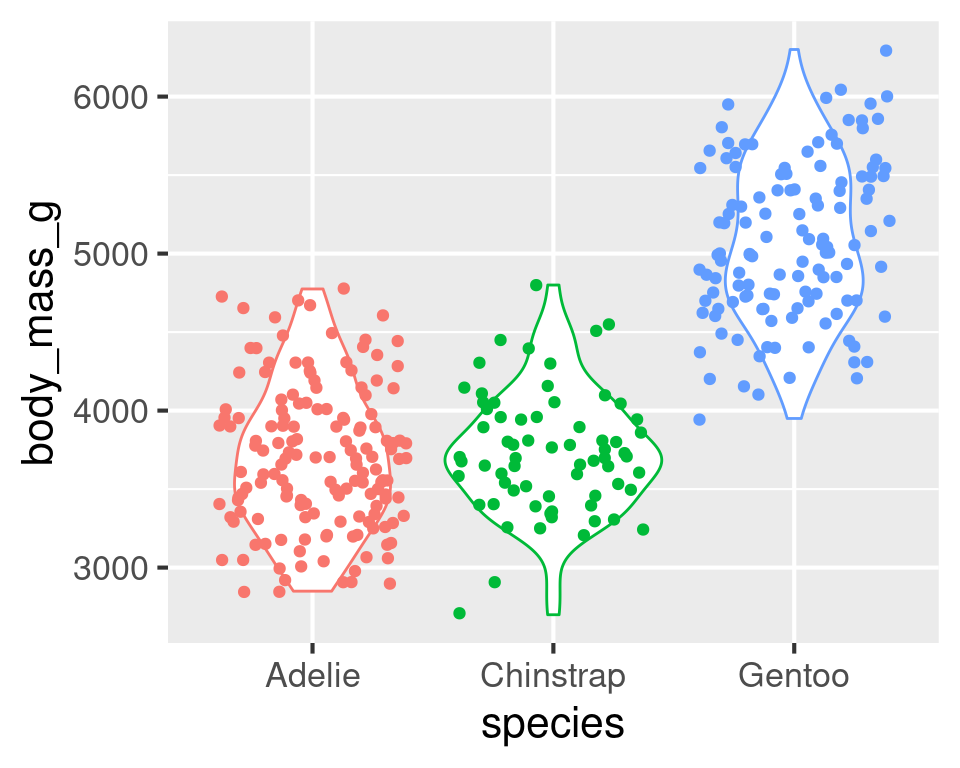
Violin plots
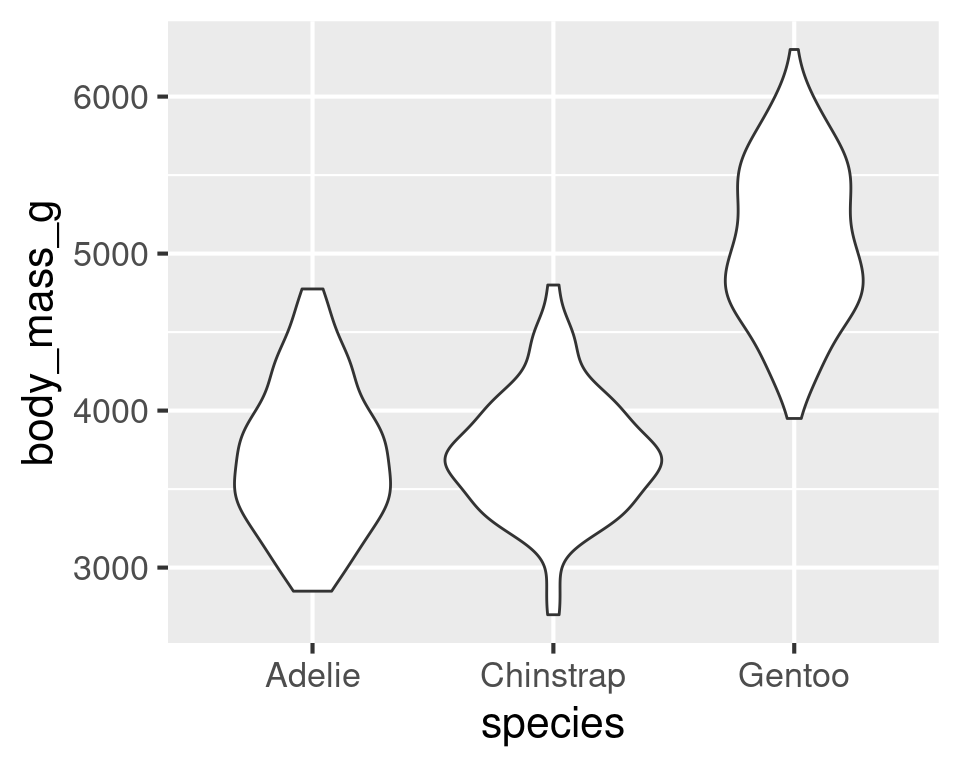
Multiple geoms
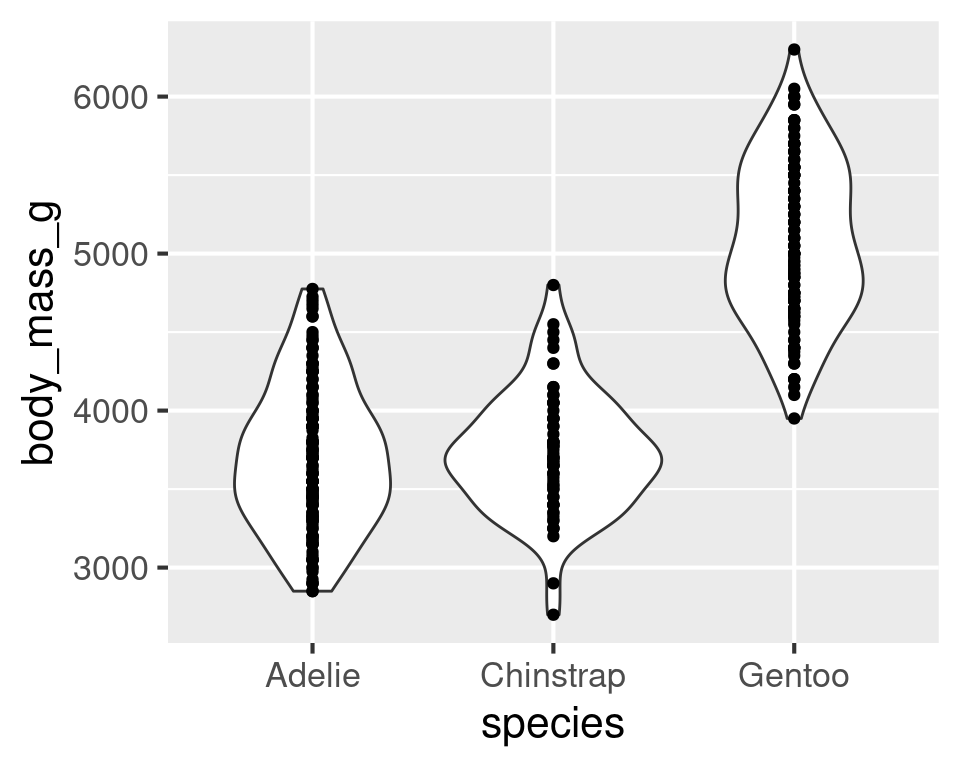
Multiple geoms
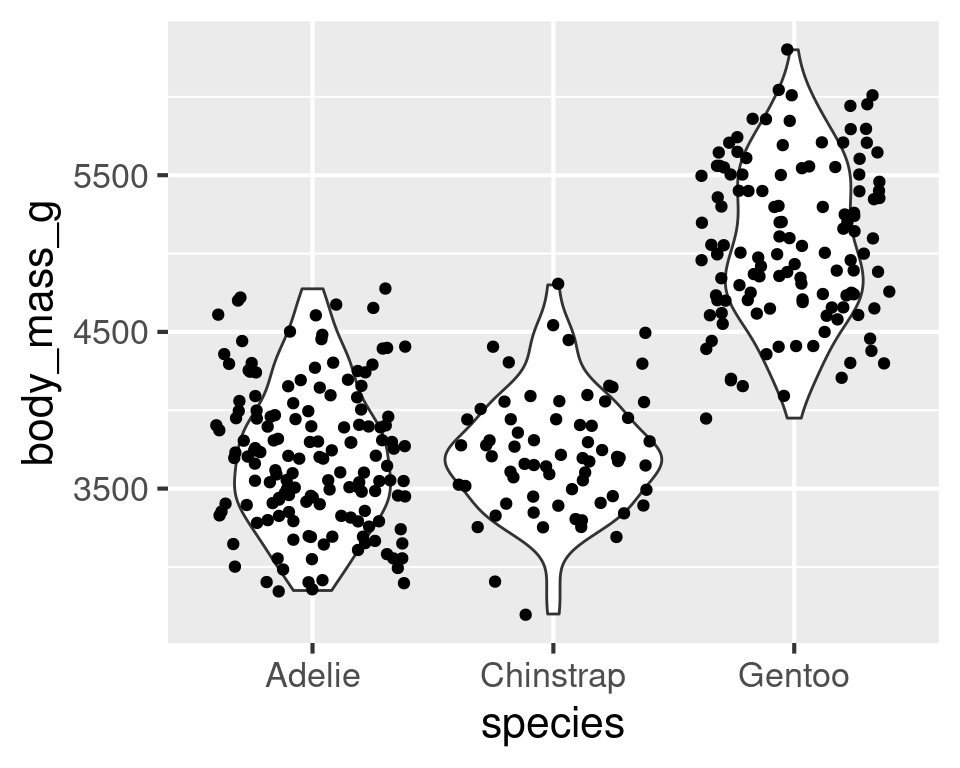
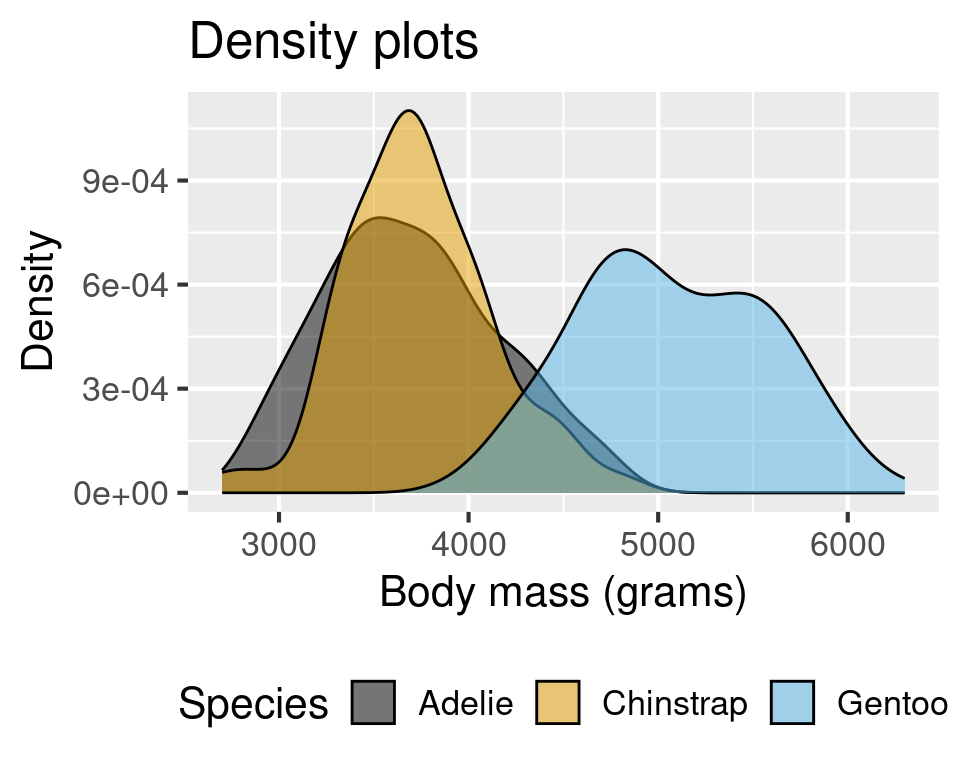
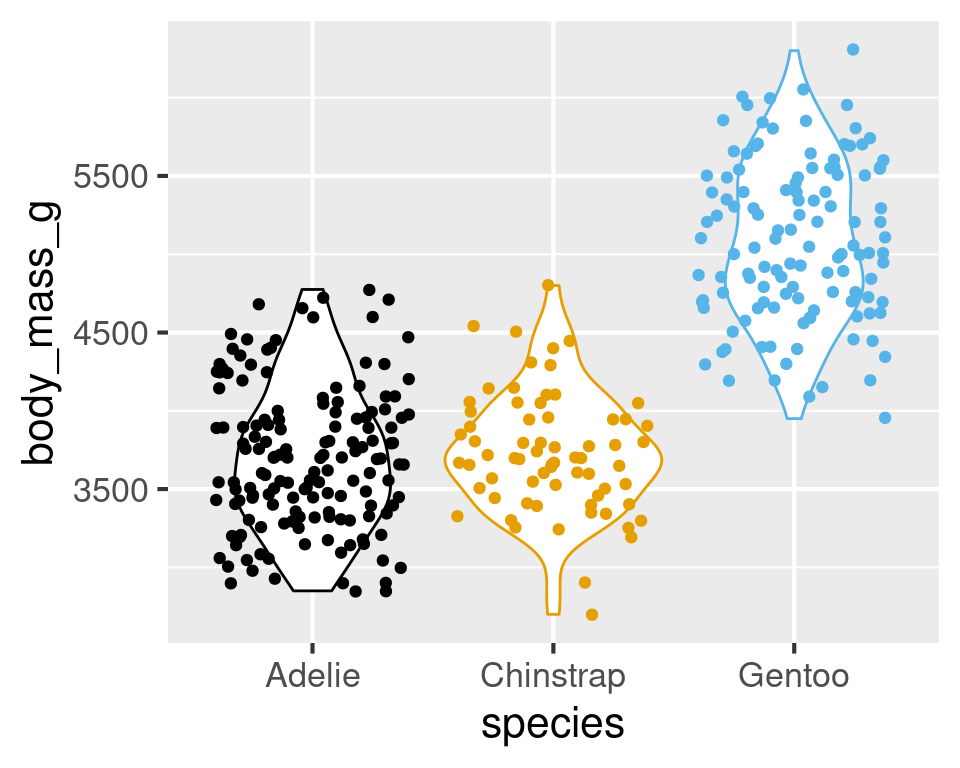
Multiple geoms + aesthetics
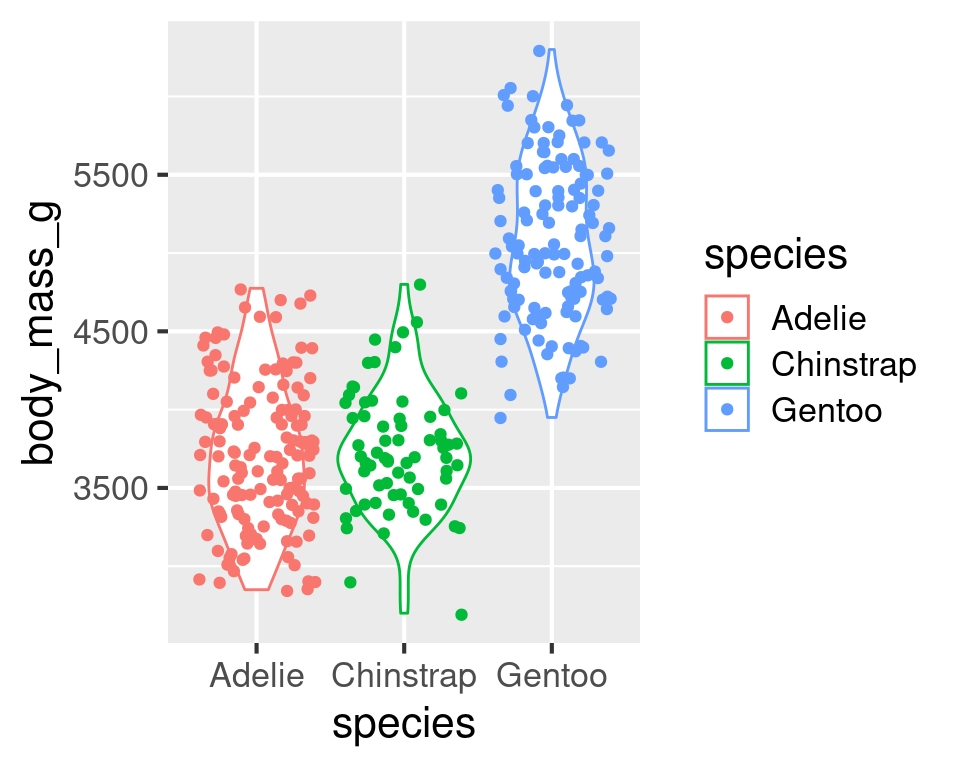
Multiple geoms + aesthetics
Multiple geoms + aesthetics
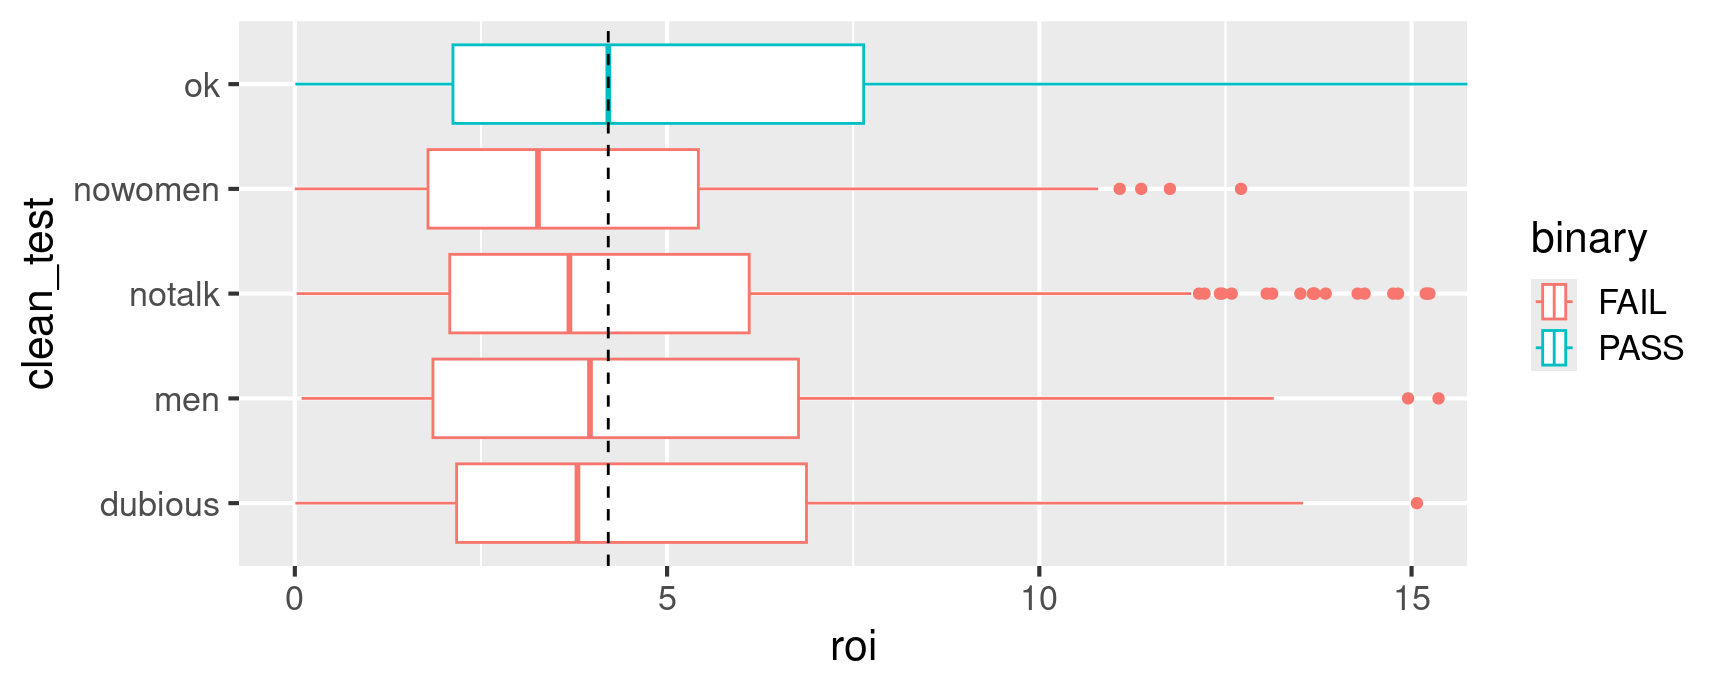
ROI by test result
What about this plot makes it difficult to evaluate how ROI varies by Bechdel test result?
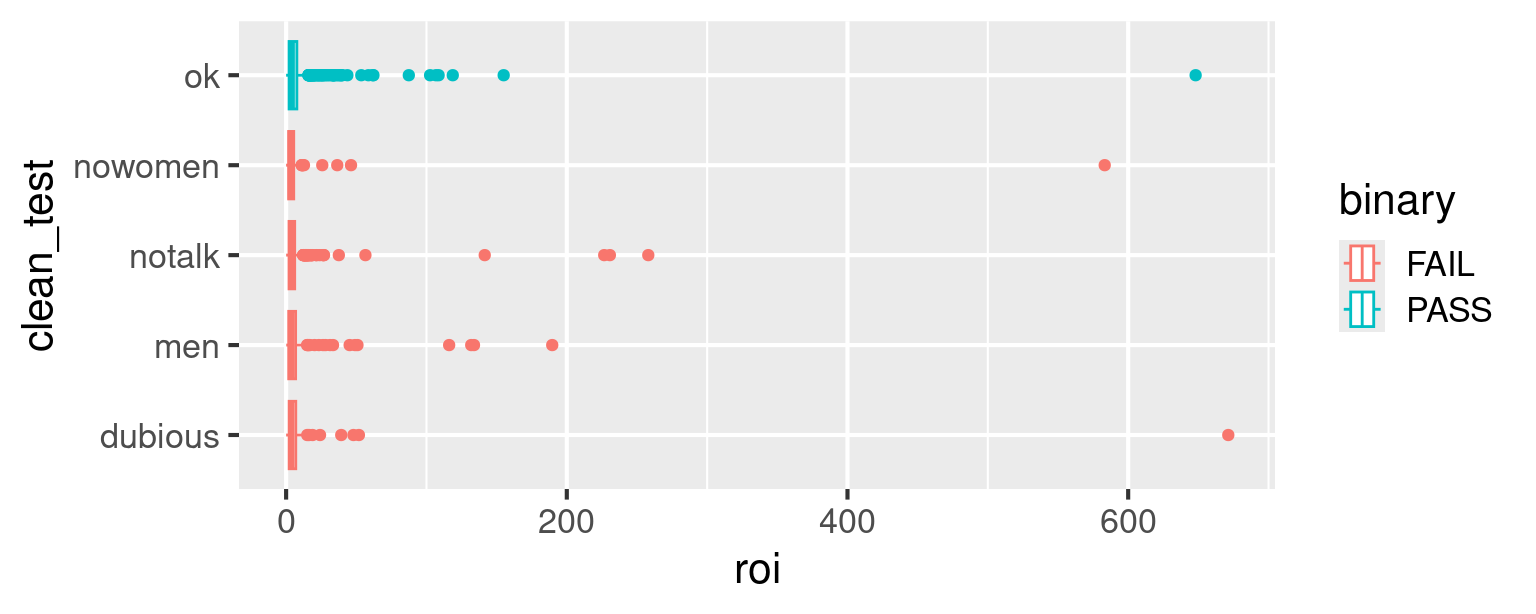
ROI by test result
Zoom in: What about this plot makes it difficult to evaluate how ROI varies by Bechdel test result?
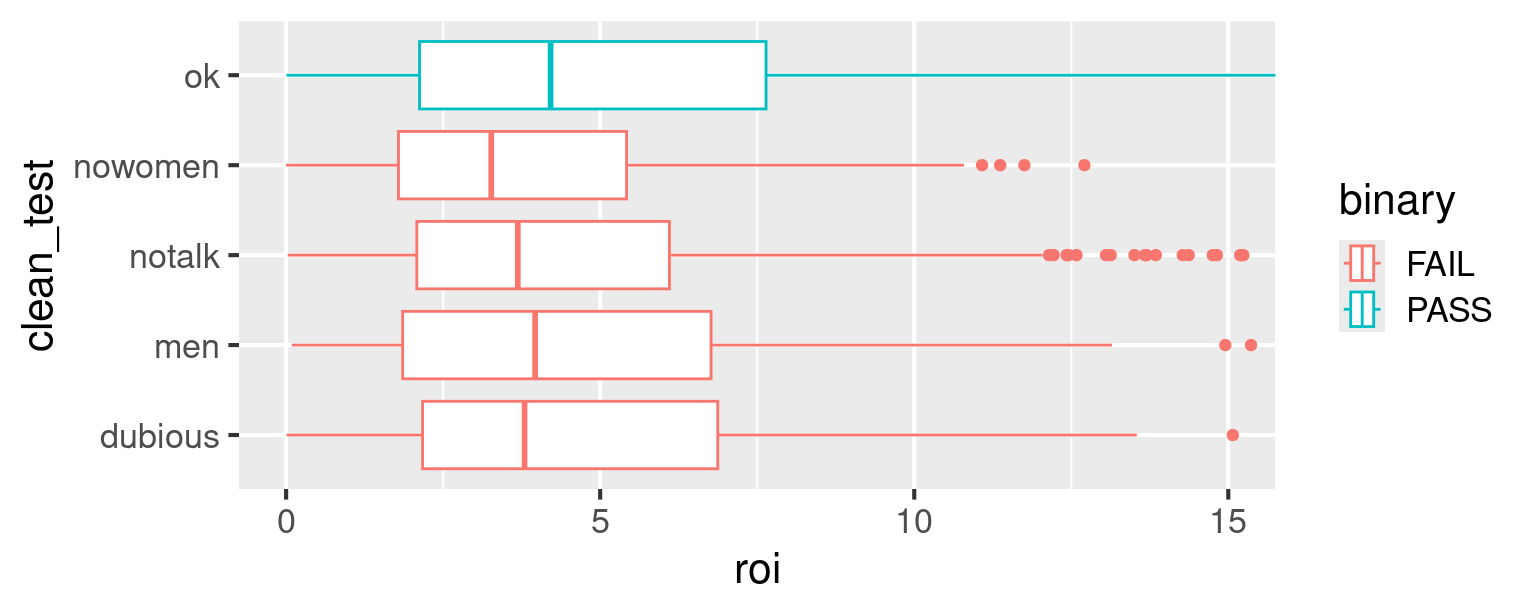
ROI by test result – zoom in
What does this plot say about return-on-investment on movies that pass the Bechdel test?
ae-03-duke-forest
If you’ve been here for a while:
and following along with the application exercises…
Go to the project navigator in RStudio (top right corner of your RStudio window) and open the project called ae. If there are any uncommitted files, commit them, and then click Pull.
If you’ve new:
or haven’t been following along with the application exercises…
Go to the course GitHub org and find your ae repo. Clone the repo in your container, open the Quarto document called ae-03-duke-forest.
![]()