# A tibble: 3 × 4
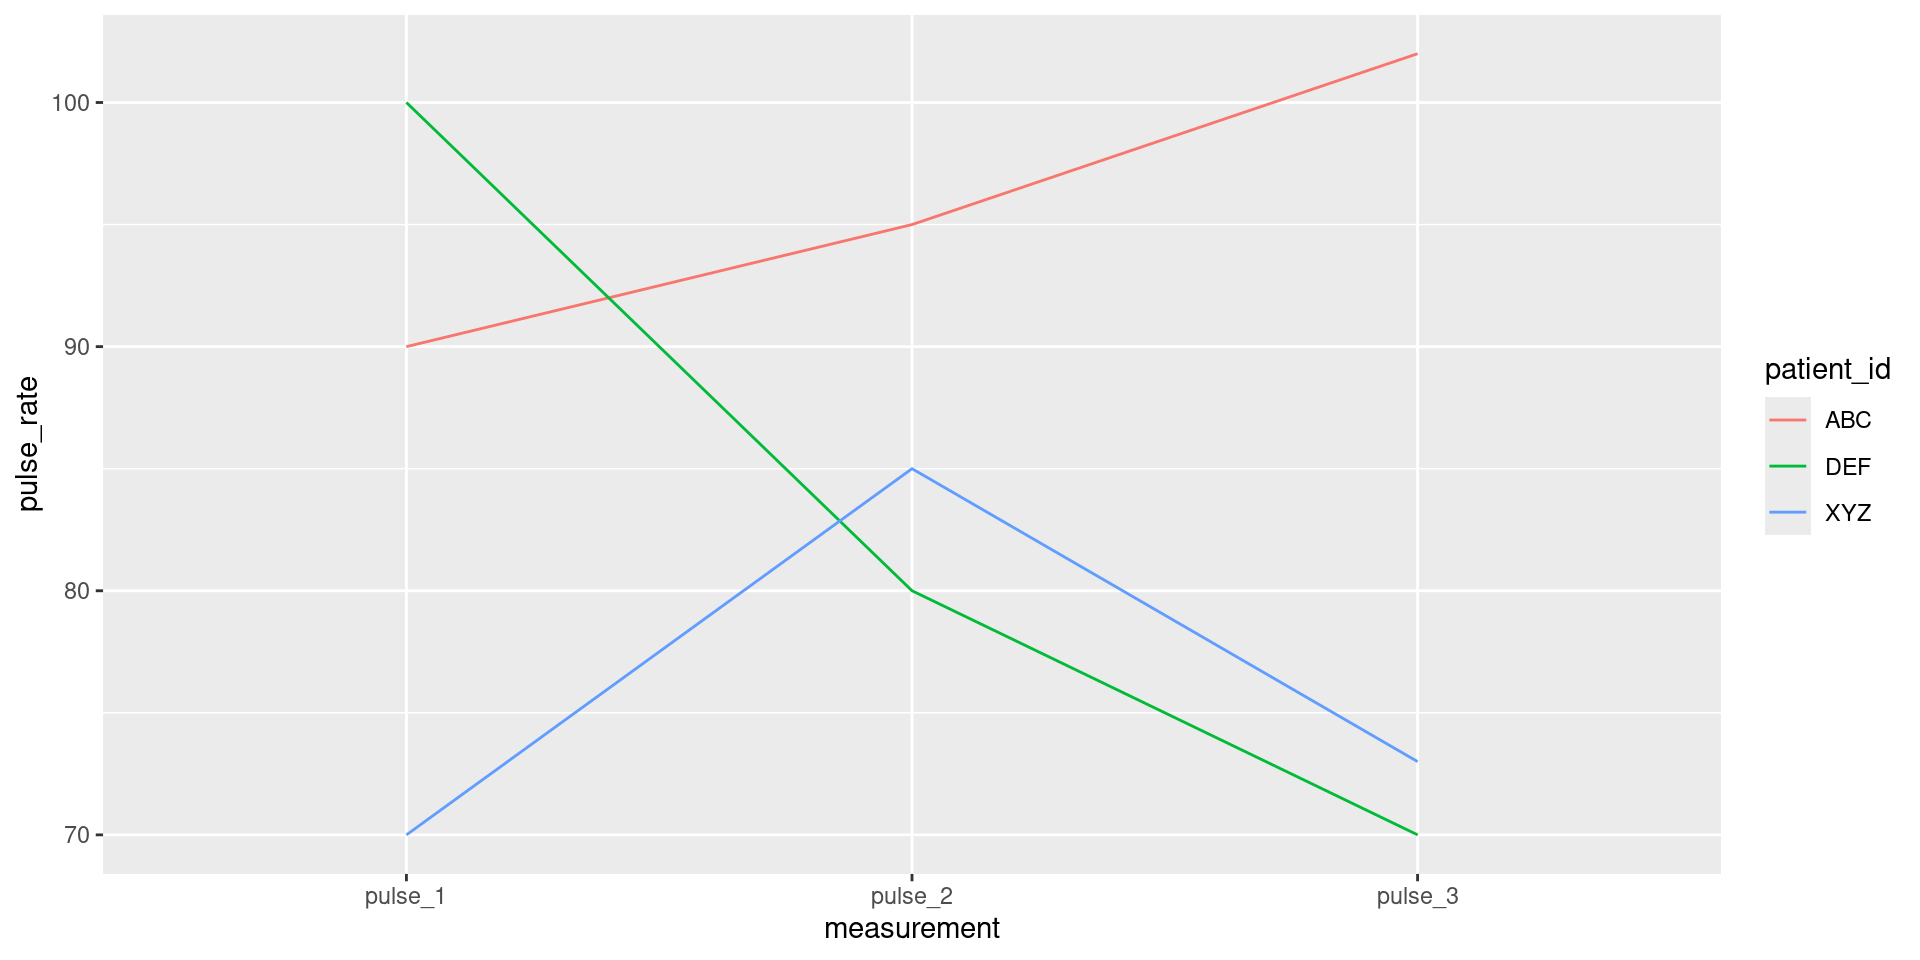
patient_id pulse_1 pulse_2 pulse_3
<chr> <dbl> <dbl> <dbl>
1 XYZ 70 85 73
2 ABC 90 95 102
3 DEF 100 80 70Data types and classes
Lecture 8
2024-02-08
Visualizing pivoted data
Factors
A factor is a vector that can contain only predefined values. It is used to store categorical data.

ae-07-population-types
Go to the project navigator in RStudio (top right corner of your RStudio window) and open the project called
ae.If there are any uncommitted files, commit them, and then click Pull.
Open the file called
ae-07-population-types.qmdand render it.
![]()