library(tidyverse)
library(openintro)AE 03: Duke Forest
Suggested answers
Application exercise
Answers
Important
These are suggested answers. This document should be used as reference only, it’s not designed to be an exhaustive key.
Packages
Exercise 1
The distributions of prices of houses with and without garages are fairly similar, with centers around $600,000. Each distribution has potential outliers on the higher end. Based on this visualization, having a garage does not appear to “make a difference”.
duke_forest |>
  mutate(garage = if_else(str_detect(parking, "Garage"), "Garage", "No garage")) |>
  ggplot(aes(x = price, fill = garage)) +
  geom_histogram() +
  facet_wrap(~garage, ncol = 1) +
  labs(
    x = "Price in $",
    y = "",
    title = "Histogram of Price of Homes by Garage or not",
    fill = "Garage or not"
  )
`stat_bin()` using `bins = 30`. Pick better value with `binwidth`.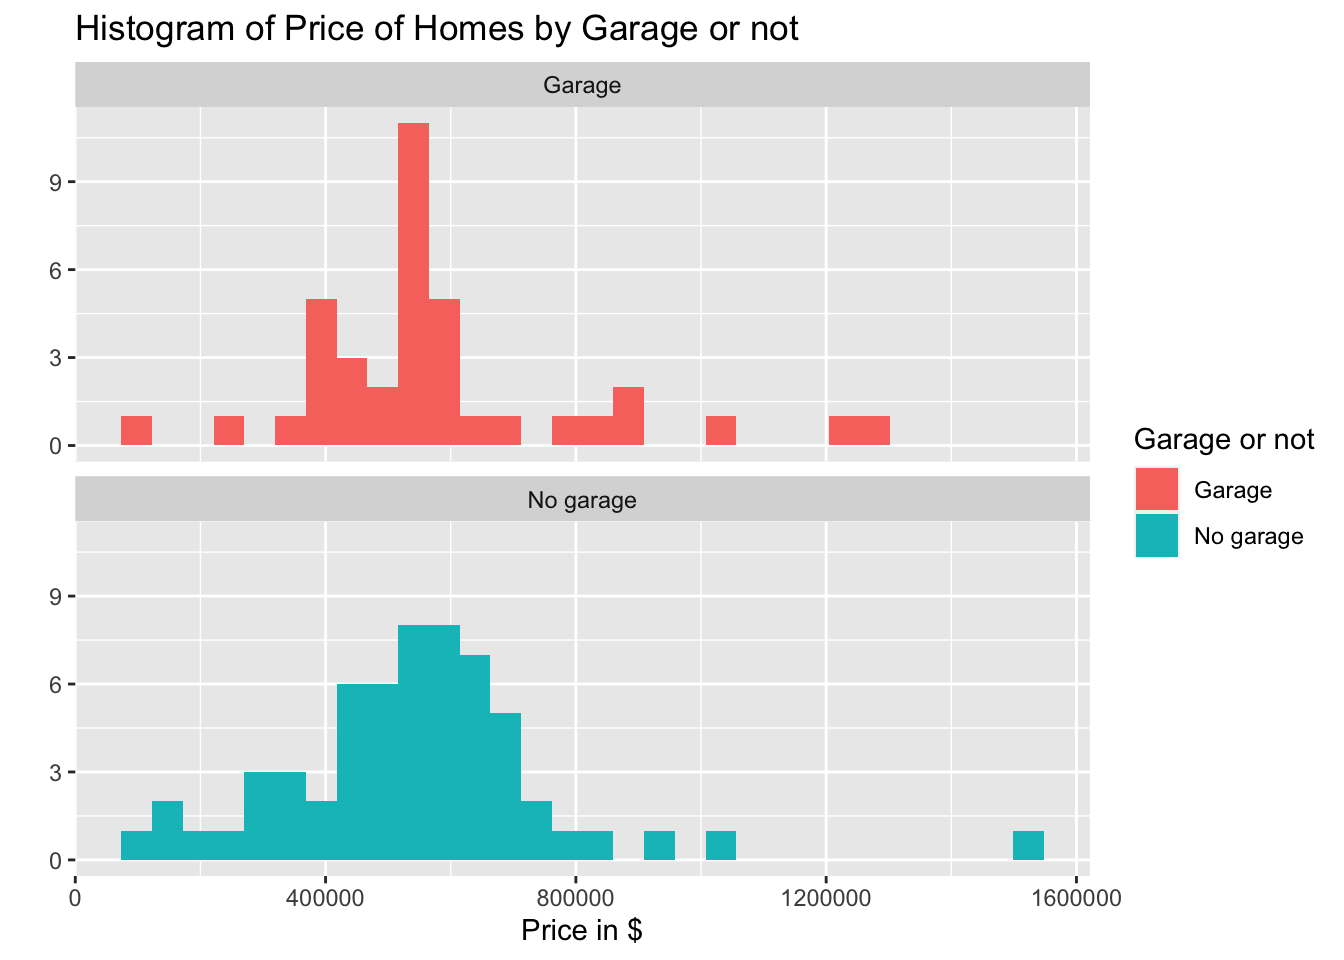
Exercise 2
- Claim 1: Yes, there seems to be evidence of a positive relationship between the price of the home and the area of the home.
- Claim 2: No, there does not seem to be a relationship between the price and age of the home.
- Claim 3: No, there does not seem to be any evidence to suggest that larger more expensive homes are newer than those houses that are cheaper and smaller. Points that are lighter colored (newer homes) are not concentrated on the top right of the plot.
ggplot(
  duke_forest,
  aes(x = area, y = price, color = year_built)
) +
  geom_point(size = 3) +
  geom_smooth(se = FALSE) +
  labs(
    x = "Area of Home",
    y = "Price of Home",
    title = "Relationship between Price and Area by Year Built",
    color = "Year Built"
  )
`geom_smooth()` using method = 'loess' and formula = 'y ~ x'Warning: The following aesthetics were dropped during statistical transformation: colour
ℹ This can happen when ggplot fails to infer the correct grouping structure in
the data.
ℹ Did you forget to specify a `group` aesthetic or to convert a numerical
variable into a factor?