name <- "\r Academic Advising Center\r"
url <- "\r\n\t\t\t\t\t\t\t\thttps://dukegroups.com/AOTA/\r\n\t\t\t\t\t\t\t"Lab 4 - Web scraping and ethics
Lab
Introduction
In this lab you’ll build the data wrangling and visualization skills you’ve developed so far and data tidying and joining to your repertoire.
Note
This lab assumes you’ve completed the labs so far and doesn’t repeat setup and overview content from those labs. If you have not yet done those, you should go back and review the previous labs before starting on this one.
Learning objectives
By the end of the lab, you will…
- Be able to scrape data from web pages using the rvest package
- Clean and analyze the data you have scraped
- Come up with your own questions about the data and answer them
- Be able to use the robotstxt package as well as read the Terms of Use/Service of a website to check if a website allows scraping
- Read articles on the ethics of AI tools and LLMs and reflect on the implications of these tools for society
Getting started
Log in to RStudio, clone your lab-4 repo from GitHub, open your lab-4.qmd document, and get started!
Click here if you prefer to see step-by-step instructions
Log in to RStudio
- Go to https://cmgr.oit.duke.edu/containers and log in with your Duke NetID and Password.
- Click
STA198-199under My reservations to log into your container. You should now see the RStudio environment.
Clone the repo & start new RStudio project
Go to the course organization at github.com/sta199-s24 organization on GitHub. Click on the repo with the prefix lab-3. It contains the starter documents you need to complete the lab.
Click on the green CODE button, select Use SSH (this might already be selected by default, and if it is, you’ll see the text Clone with SSH). Click on the clipboard icon to copy the repo URL.
In RStudio, go to File ➛ New Project ➛Version Control ➛ Git.
Copy and paste the URL of your assignment repo into the dialog box Repository URL. Again, please make sure to have SSH highlighted under Clone when you copy the address.
Click Create Project, and the files from your GitHub repo will be displayed in the Files pane in RStudio.
Click lab-3.qmd to open the template Quarto file. This is where you will write up your code and narrative for the lab.
First steps
In lab-3.qmd, update the author field to your name, render your document and examine the changes. Then, in the Git pane, click on Diff to view your changes, add a commit message (e.g., “Added author name”), and click Commit. Then, push the changes to your GitHub repository, and in your browser confirm that these changes have indeed propagated to your repository.
Packages
In this lab we will work with the following packages:
- tidyverse: for tidy data wrangling and visualization
- rvest: for data scraping
- robotstxt: for checking the robots.txt files of websites for permission to scrape data
- knitr: for making a pretty table
Some of the later questions in the lab ask you to come up with your own questions about the data and answer them. If this requires additional packages, you should feel free to load them as well.
Guidelines
As we’ve discussed in lecture, your plots should include an informative title, axes should be labeled, and careful consideration should be given to aesthetic choices.
In addition, the code should all the code should be be able to be read (not run off the page) when you render to PDF. Make sure that is the case, and add line breaks where the code is running off the page.1
Note
Continuing to develop a sound workflow for reproducible data analysis is important as you complete the lab and other assignments in this course. There will be periodic reminders in this assignment to remind you to render, commit, and push your changes to GitHub. You should have at least 3 commits with meaningful commit messages by the end of the assignment.
Questions
Part 1 - Scraping data from web pages
Question 1
Important
You do not need to do anything in your Quarto file for this question. All of the work for this question will be done in lab-4-clubs-scrape.R.
Your task for this question is to scrape data on Duke Student Groups from https://dukegroups.com/club_signup?view=all. Scroll down and click on load all groups.
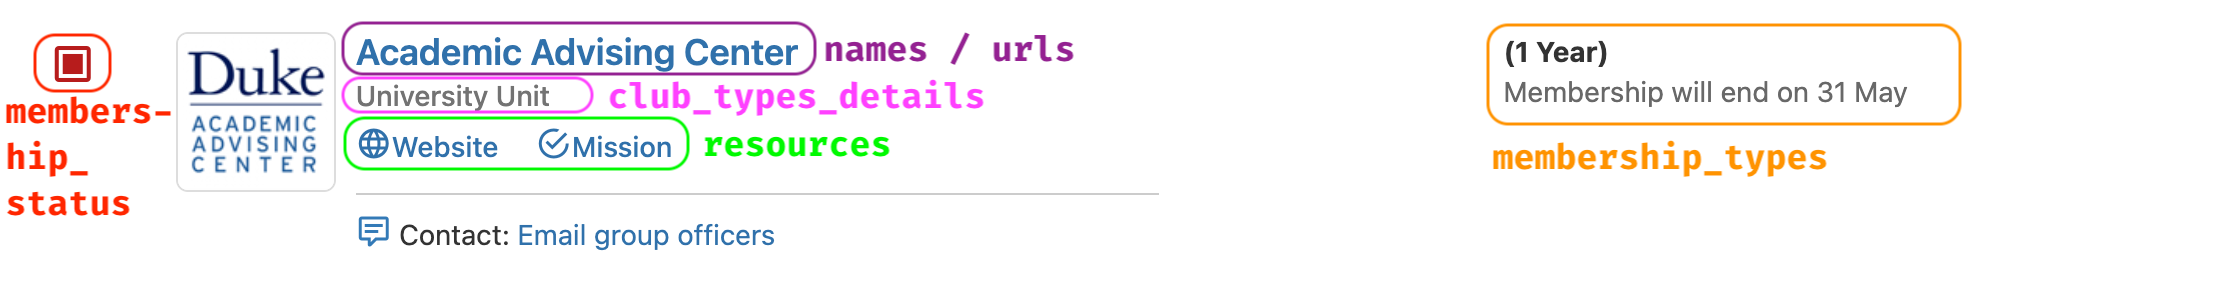
You will do this in lab-4-clubs-scrape.R, which gives some scaffolding for you to complete this task. The goal is to scrape information on
- Name of club:
names - Link to club page:
urls - Type of club:
club_types - Resources of club:
resources - Membership type of club:
membership_types - Checkboxes that indicate the club is open / closed for joining:
membership_status
The scheme shown in the image should also help you figure out which pieces of information come from which parts of the website.
You will scrape each of these as individual vectors, clean them up a bit, and then bring them together in a data frame (a tibble) and write it out to a CSV file called clubs.csv in the data folder of your project/repository.
Hint
There are some hints for cleaning the data in the script provided for you. For example, some of the fields you scrape will have some extraneous characters in them like \ns, \rs, etc. Two examples are provided below.
To clean these up, first, we would want to remove the extraneous characters. The stringr package (which comes with the tidyverse) offers some great functions for dealing with such nuisance, see https://stringr.tidyverse.org/reference/index.html for a full list. In this case, we can use the following steps:
str_remove()to remove the character(s) once orstr_remove_all()to remove all occurences of the character(s) we don’t want
name |>
  str_remove_all("\r")
url |>
  str_remove_all("\r") |>
  str_remove_all("\n") |>
str_remove_all("\t")str_trim()for trimming white space at the beginning and end of text strings
name |>
  str_remove_all("\r") |>
  str_trim()
These types of functions will be helpful for cleaning the data you scrape as well.
Part 2 - Data cleaning
Question 2
Read the clubs.csv file you created in Question 1 into your Quarto document.
The club_type_detail variable contains two pieces of information for most (though not all) clubs:
- Many of the entries are of the form
House/Quad Council - Housing & Residence LifeorOpen Membership (DSG) - Faith, Religion, & Spirituality, where the piece before the hyphen (-) isclub_typewhile the piece after the hyphen isdetail. - Some of the entries are of the form
Student GovernmentorStudent Affairs Unit, basically justclub_typebut nodetail.
Separate the club_type variable into two, club_type and detail, and then trim any extraneous white space from the resulting variables, as needed. Save the resulting dataset with these two new variables as clubs, i.e., overwrite the data frame.
Then, display the first 10 rows of the dataset, relocate()ing club_type and detail variables to the beginning of the dataset to make sure they appear in the output in your rendered document.
Question 3
Another variable that needs some cleaning up is membership_status. Currently it should either be NA or contain some text that says "Select ... to register for this group". Recode this variable to say "Closed" if the current value is NA or "Open" otherwise. Save the resulting dataset with these two new variables as clubs, i.e., overwrite the data frame.
Then, display the first 10 rows of the dataset, relocate()ing membership_status to the beginning of the dataset to make sure it appears in the output in your rendered document.
Warning
At this point you should have a clubs dataset with seven columns in the following order:
nameresourcesclub_typedetail: May be blank for some clubsmembership_typemembership_status: with valuesOpenandClosedurl
If your dataset has a structure of columns different than what’s outlined above, go back to earlier exercises and review your answers.
Part 3 - Data analysis
Question 4
Solve each of the following questions (parts) with a single pipeline.
- Find the distinct
membership_types and the number of clubs with each type of membership. - Find the number of clubs that have a Mission statement.
- Find the clubs that are
Greekand mentionFaithin their detail.
Question 5
Recreate the following table in a single pipeline.

Hint
First, count the number of clubs that fall into each
club_typeandmembership_status.Then, pivot the resulting data frame so the levels of
membership_statusare across two columns as opposed to in a single column.Read the documentation for the pivoting function you’re using to discover how you can replace
NAs with 0s while pivoting the data.Create a new column
Totalthat is the sum ofClosedandOpencolumns.Use the
kable()function (refer back to your take-home exam if you need a hint) to nicely format your table.
Question 6
Ask a simple question of interest to you about student clubs at Duke that you can answer with these data. Then, answer your question in a single pipeline and a brief narrative describing your findings. If your question is too complex to answer in a single pipeline, go back and revise your question.
Question 7
Ask another question of interest to you about student clubs at Duke that you can answer with a visualization of these data. Then, answer your question, with a visualization and a brief narrative describing your findings.
Note
If you are collaborating with classmates and brainstorming possible questions together, make sure the questions you choose are unique to you.
Part 4 - Ethics
Important
The following two questions ask you to summarize articles on data science ethics. You are not allowed to use Chat GPT or similar tools in answering these questions – you must actually read the articles and summarize them yourself. Please be ethical, at a minimum when discussing ethics!
Question 8
For each of the following websites, first determine whether you’re allowed to scrape data from them using tools we’ve learned in this course.
Then, read (the relevant portions of their) Terms of Use/Service.
- ESPN: https://www.espn.com / https://disneytermsofuse.com/english/#License-Grant-and-Restrictions
- X/Twitter: https://twitter.com / https://twitter.com/en/tos
- Rotten Tomatoes: https://www.rottentomatoes.com / https://www.rottentomatoes.com/policies/terms-of-use
Finally, summarize your findings about whether you can or cannot scrape data from these websites in 1 sentence for each website. Additionally, quote the relevant sentence(s) from the Terms of Use/Service.
Hint
In the Terms of Use/Service documents, it might be productive to search for keywords like “scrape” or “scraping” to find the relevant portions.
Question 9
One current ethical discussion in data science involves the training of “Large Language Models” such as ChatGPT. These models are trained using massive corpora (document sets) that include large amounts of work that is covered under copyright law. Read the following two articles:
Write a short paragraph (maximum 8 sentences) discussing the arguments on both sides of the discussion over copyright in training large language models.
Question 10
Another major ethical discussion in data science resolves around discriminatory biases in machine learning models. These biases can have real-world impacts in lending, criminal justice, hiring, and more. Many of these algorithms are so-called “black boxes”, meaning the exact process they take from input to output is unclear. Read the following articles:
- Amazon scraps secret AI recruiting tool that showed bias against
- The Atlantic: The False Promise of Risk Assessment
Write a short paragraph (maximum 8 sentences) discussing the nature of biases in machine learning and in datasets, and any possible solutions that could help limit those biases.
Wrap-up
Submission
Once you are finished with the lab, you will submit your final PDF document to Gradescope.
Warning
Before you wrap up the assignment, make sure all of your documents are updated on your GitHub repo. We will be checking these to make sure you have been practicing how to commit and push changes.
You must turn in a PDF file to the Gradescope page by the submission deadline to be considered “on time”.
To submit your assignment:
- Go to http://www.gradescope.com and click Log in in the top right corner.
- Click School Credentials \(\rightarrow\) Duke NetID and log in using your NetID credentials.
- Click on your STA 199 course.
- Click on the assignment, and you’ll be prompted to submit it.
- Mark all the pages associated with question. All the pages of your lab should be associated with at least one question (i.e., should be “checked”).
Checklist
Make sure you have:
- attempted all questions
- rendered your Quarto document
- committed and pushed everything to your GitHub repository such that the Git pane in RStudio is empty
- uploaded your PDF to Gradescope
- selected pages associated with each question on Gradescope
Grading
The lab is graded out of a total of 50 points.
You can earn up to 5 points on each question:
5: Response shows excellent understanding and addresses all or almost all of the rubric items.
4: Response shows good understanding and addresses most of the rubric items.
3: Response shows understanding and addresses a majority of the rubric items.
2: Response shows effort and misses many of the rubric items.
1: Response does not show sufficient effort or understanding and/or is largely incomplete.
0: No attempt.
Footnotes
Remember, haikus not novellas when writing code!↩︎